![]() To test our
hypothesis that the cloud is a result of the collision between a tidal
stream and a stellar wind, we ran a numerical simulation using the hydrodynamics
code VH-1 on a Cray
T90 at the North Carolina State Supercomputing
Center.
To test our
hypothesis that the cloud is a result of the collision between a tidal
stream and a stellar wind, we ran a numerical simulation using the hydrodynamics
code VH-1 on a Cray
T90 at the North Carolina State Supercomputing
Center.
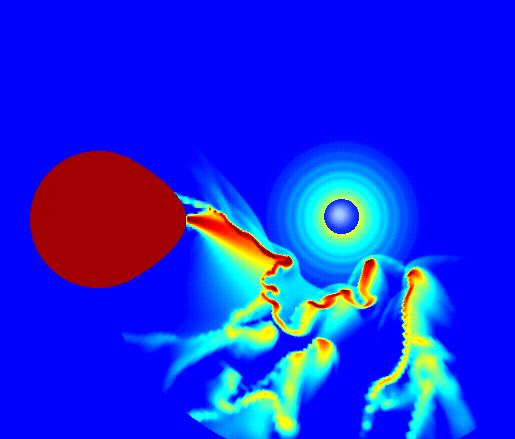
 This image
shows the stream being broken up by the Rayleigh-Taylor instability as
the pressure of the stellar wind pushes the stream away from the blue star.
The result is not one large cloud, but a region filled with many small
clouds being blown radially away from the star. The dynamics of this collision
are best seen in the movie created by our numerical
simulation.
The time-averaged column density along the line of sight to the blue star
is plotted as a function of orbital phase. This curve shows an extended
region of enhancement centered on orbital phase 0.75. This differs from
the observed UV light curve because it also includes lines of sight
through the tidal stream at phase 0. This is not seen in the observations
of AX Mon because the orbital system is inclined to our line of sight
(there is no eclipse). Thus, for this stream/wind model to work, the vertical
extent of the clumpy region must exceed 20 degrees off the orbital plane.