Initial Results From 3D Model

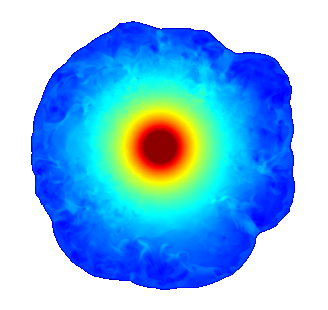
This animation shows the evolution of density (blue=low, red=high)
in a 2D slice through the middle of the supernova
during the second 100 ms of the simulation.

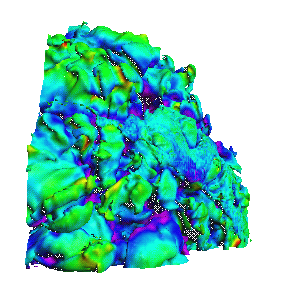
This 3D rendering of an isotemperature surface illustrates the
convection occuring behind the accretion shock. The coloring of
the isosurface is based on the radial velocity, with red representing
upwelling and violet representing downdrafts. Only one octanct of
the full simulation is visualized here.

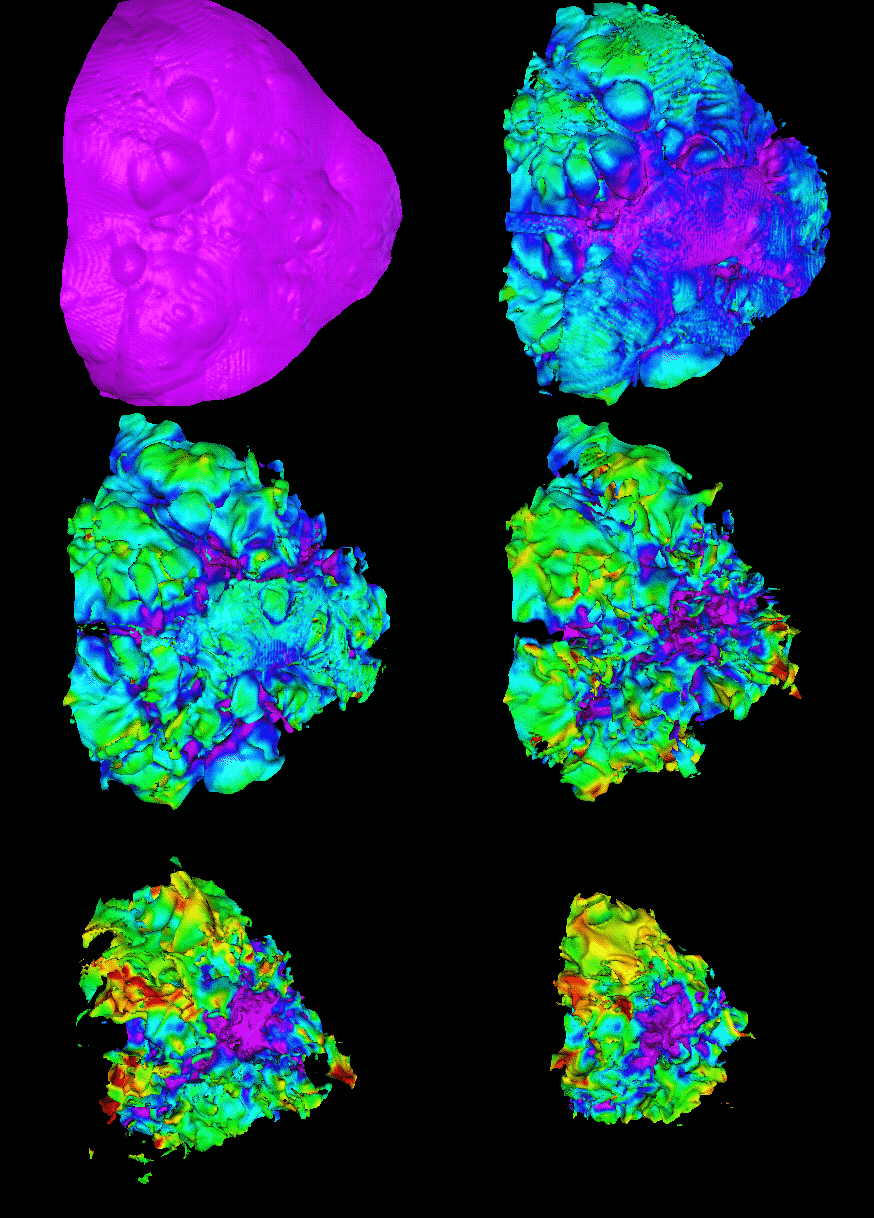
This animation peels away successive layers of increasing temperature,
beginning with the surface of the accretion shock.


