Instability of Isothermal Stellar Wind Bowshocks
Figures
 Figure 1 -
Schematic of the idealized stellar wind bowshock. A uniform
flow approaches the bowshock from the right and a spherically symmetric wind
emanates from the position of the star. The heavy line is the equilibrium
bowshock solution of Wilkin (1996). The coordinates are measured in units
of the stand-off distance R_so.
 Figure 2 -
Snapshot in time from the high-resolution
simulation of an unstable isothermal bowshock with M = 10.
The full time evolution of this unstable bowshock
is shown in the accompanying animation.
The shading represents
the gas density, with black corresponding to the highest density. The
solid line marks the analytic solution for the shape of a thin bowshock
as given by Wilkins (1997). Animation
 Figure 3 -
The flow velocity within a section of the unstable bowshock
shown in Figure 2. The ISM flows uniformly in from the right while the
stellar wind, with some spherical divergence evident, flows in from the left.
The solid lines mark the inner and outer shocks bounding the bowshock shell.
The shear inside
the shell is similar to that seen in the NTSI, with postshock flow directed towards
extrema in the perturbed slab.
 Figure 4 -
The departure of the shell orientation in the center of this
image from the equilibrium
solution (shown as a solid line) results in the stellar wind impacting
the shell almost head on at this location, while the ISM flow barely grazes
the surface of the shell. The result is a gross imbalance of the momentum
delivered to the shell, driving it away from the star. This is the
Transverse Acceleration Instability.
 Figure 5 -
Dependence of bowshock evolution on numerical resolution.
The three images correspond to low (120x120), medium (240x240), and high
(480x480) resolution simulations of a Mach = 5 simulation.
Although there is more small scale structure in the higher resolution simulations,
all three look qualitatively similar, with the same dominant wavelength of
approximately R_so.
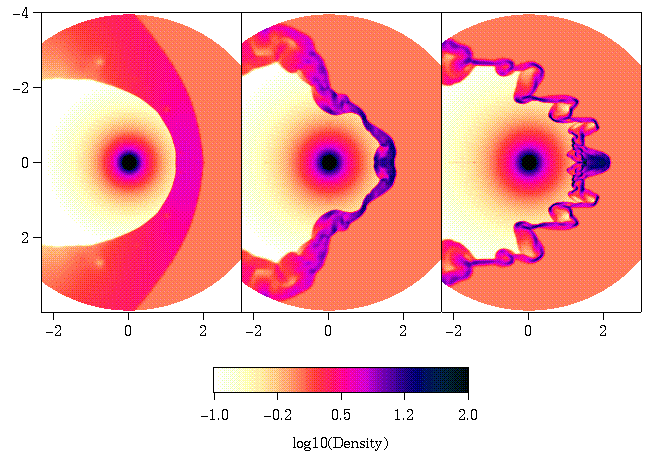 Figure 6 -
The bowshock instability increases
with increasing Mach number of the stellar wind
and ISM flow. The Mach numbers are, from left to right, 2.5, 5, and 10.
The role of the instability as a function of Mach number
is best seen in the accompanying animations.
Animations: Left | Center |
Right
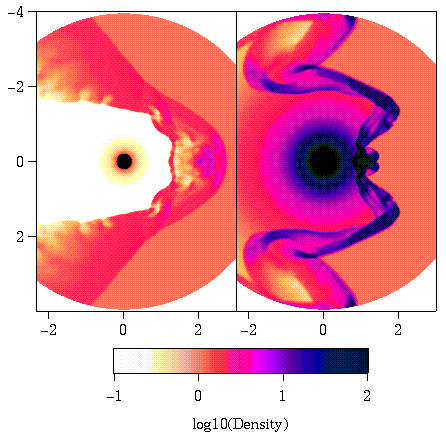 Figure 7 -
Bowshocks are more unstable for large v_* than for large v_w. The
image on the left is from a simulation with v_w = 8 and v_* = 2 (beta = 4), and
on the right from a simulation with v_w = 2 and v_* = 8 (beta = 0.25).
The evolution of these bowshocks is shown in the accompanying animations.
Animations: Left | Right
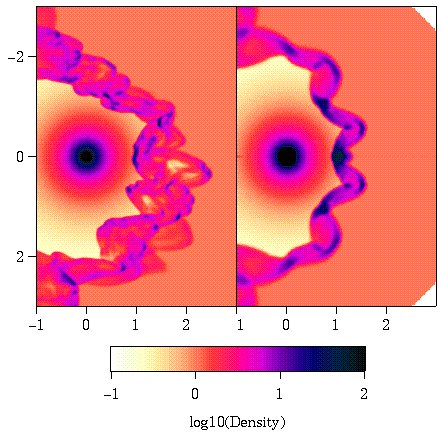 Figure 8 -
Comparison of bowshock evolution in two (right) and three (left)
dimensions.
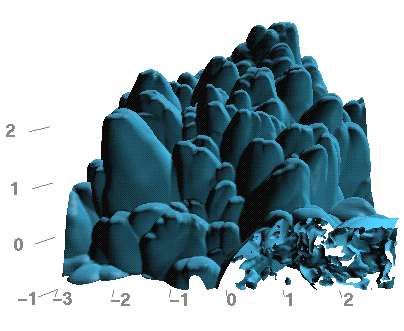 Figure 9 -
An isodensity surface showing the
leading surface of the bowshock in the three-dimensional simulation. The onrushing
ISM is approaching the bowshock from above, and the source of the stellar wind
is buried in the center of this image at coordinates (0,0,0). The accompanying
animation shows a short time segment in the evolution of this bowshock surface.
Animation
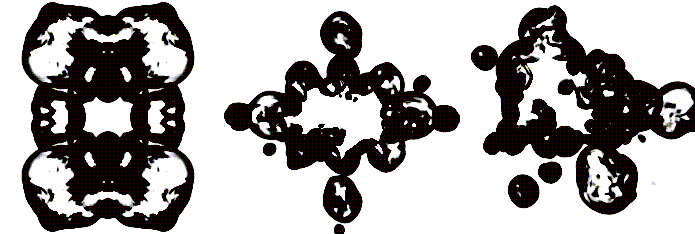 Figure 10 -
Effects of initial conditions on a Cartesian grid are evident in this
slice through the three-dimensional simulation. Black corresponds to the high
density gas in the bowshock shell. The times for these images are, from left to
right, 14.7, 23.2, and 34.3, in units of the flow time R_so/v_w.
The accompanying animation shows the full time evolution.
Early in the evolution (left image) the bowshock
exhibits clear symmetry. Around a time of 23 R_so/v_w, this symmetry quickly disappears.
Animation


