X-Ray Spectra of Cassiopeia A


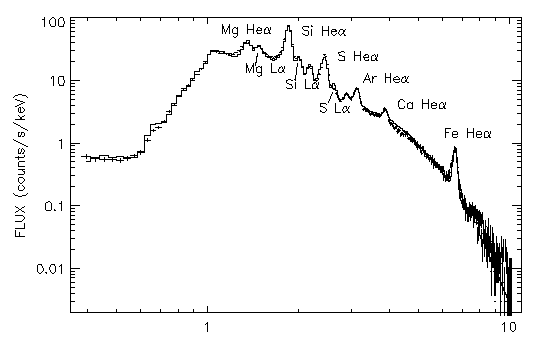
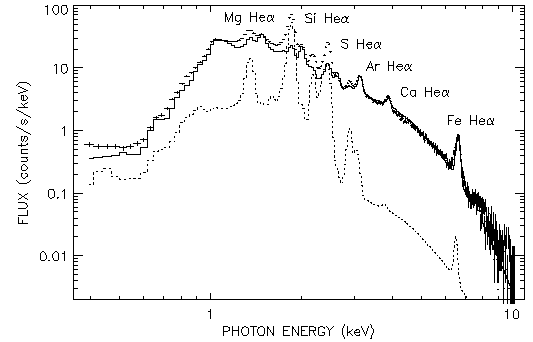
The spatially-integrated spectrum of Cas A obtained with the ASCA Solid-state Imaging Spectrometers. The calculated X-ray spectrum is shown by the solid curve in the top panel, while the bottom panel shows the contributions from the CSM (solid curve) and from the SN ejecta (dotted curve) separately. The Ar He alpha line at 3.12 keV was not included in these calculations -- this line was simply fitted by a Gaussian.