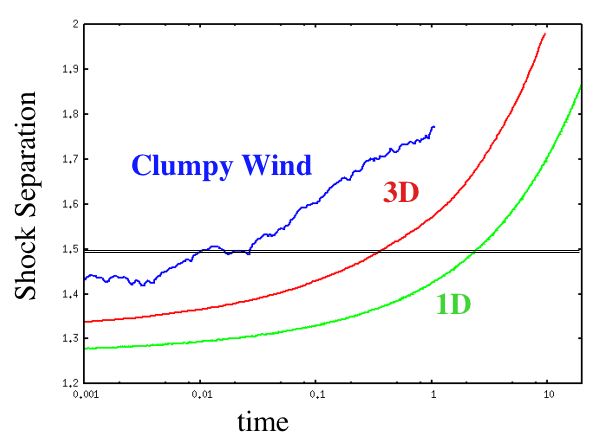
How does a clumpy progenitor wind affect the structure of a supernova remnant? Here we follow Chevalier and Oishi (ApJ 593,23) and use the harmonic mean ejecta profile of Matzner and McKee (ApJ 510, 379) to model the Cassiopeia SNR using 3D hydrodynamic simulations. The plot below shows the evolution of the SNR in terms of the position of the reverse shock relative to the forward shock. The time coordinate corresponds to the ratio of swept up mass to total ejecta mass. The horizontal line marks the approximate state of the Cass A SNR today.
This animation shows a 2D slice from one of the simulations with a cloudy progenitor wind. The simulation is computed on an expanding grid, so the forward shock remains in approximately the same location in the image even though the shock radius expands by several orders of magnitude during the simulation.
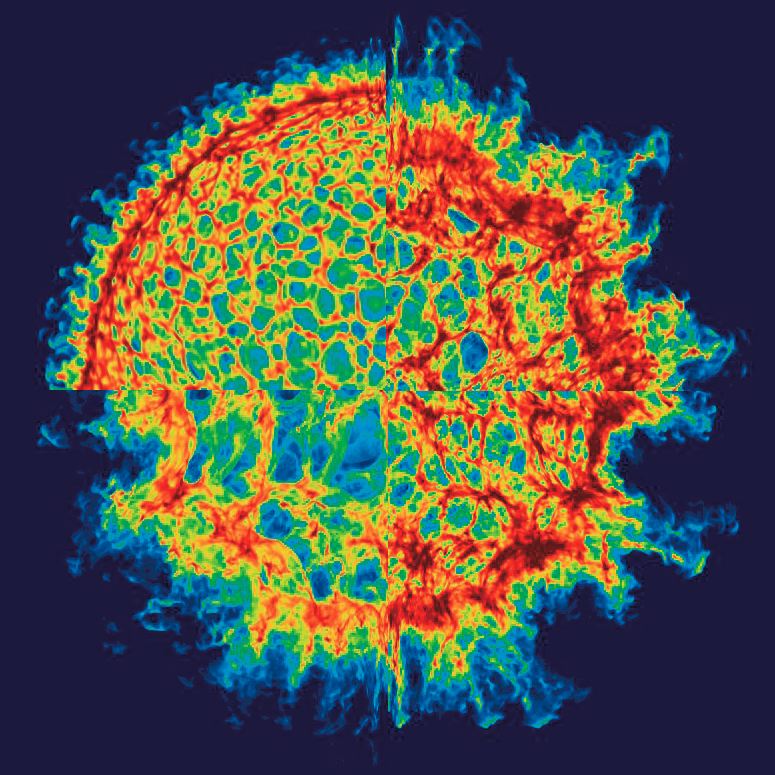
This image below is a montage from 4 different simulations. The images are created by integrating the square of the density of shocked ejecta along the line of sight, and are intended to give a rough impression of these simulationed remnants would appear in X-ray emission. The top left image is from a simulation with a smooth progenitor wind. All the structure seen here is due to the Rayleigh-Taylor instability described in Chevalier, Blondin and Emmering (ApJ 392, 118). The other 3 simulations are evolved with a random placement of spherical clouds in the progenitor wind. The top right panel is from a simulation where the clouds had a radius equal to 5% of the distance from the star, and the bottom right panel corresponds to a simulation with clouds that are 3 times larger. In all cases the filling fraction of clouds is about 20%.