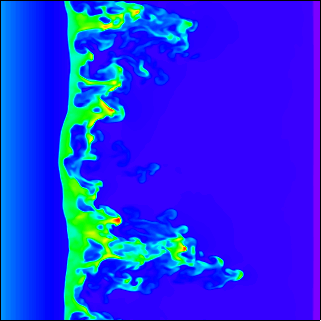
Our first simulation uses the simplest model for a young SNR: a self-similar driven wave. Even in this case of spherically symmetric ejecta and a smooth circumstellar medium, there is significant structure in the SNR as a result of the instability of the contact discontinuity separating the shocked ejecta and the shocked CSM.
This image shows the gas density from a 2D simulation. The two black
lines mark the reverse shock (left) and forward shock (right) as the SNR
propagates to the right. As the SNR decelerates, the dense
shell of shocked ejecta shown in purple is subject to the Raleigh-Taylor
instability. In 2D this produces "fingers" of dense ejecta that push
forward roughly half way toward the forward shock.
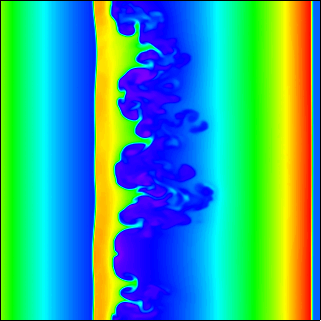
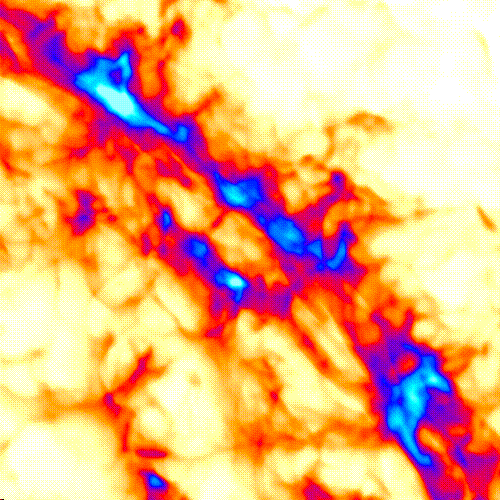
In this next image we show a volume rendering of the gas density from a 3D simulation, as viewed looking directly down onto the shocked layer. The low density of the shocked CSM is virtually transparent, so this image is showing the structure of the unstable layer of shocked ejecta. The Raleigh-Taylor fingers seen in 2D simulations are now seen as a network of filaments.
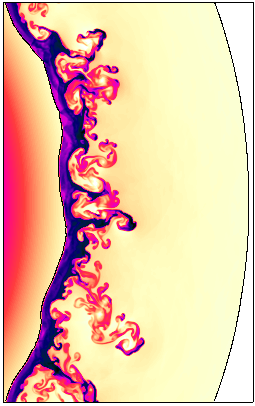
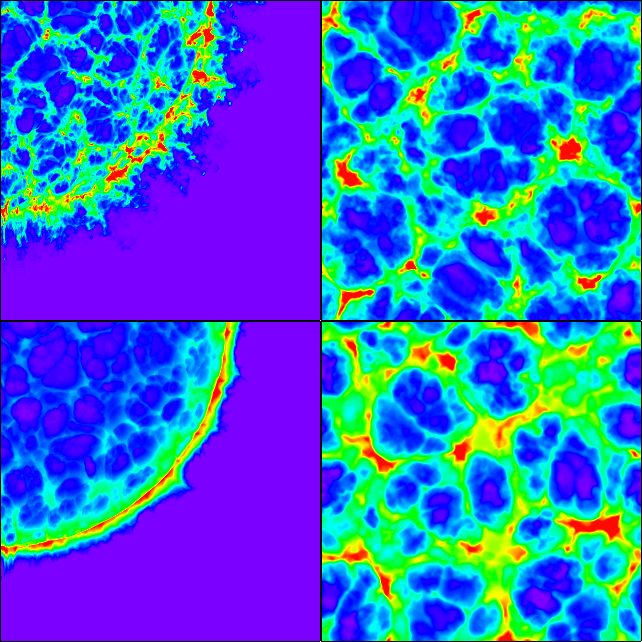
The impact of this instability on the observed morphology of a young
SNR is illustrated here in a map of the emission measure of the ejecta
integrated along the line of sight through the 3D model.
 The color map corresponds to the line of sight emission measure of the
ejecta only. The black circle is the location of the forward shock.
The color map corresponds to the line of sight emission measure of the
ejecta only. The black circle is the location of the forward shock.
These animations show the evolution of the structure of the shocked ejecta in the expanding reference frame of the SNR:
 Close-up of a region containing the edge-brightened reverse shock.
Links to animations:
Close-up of a region containing the edge-brightened reverse shock.
Links to animations:
Here we see images generated from 3D ssdw simulations, the top row is a model running into a relic stellar wind (s=2) and the bottom row is a model driven wave running into a constant density csm (s=0). Both models have an ejecta density powerlaw with n=6.
The left images show the emission measure (density squared) of shocked ejecta integrated along a line of sight through the 3D model. The right images show the radial column density (integrating the density of shocked ejecta along radial rays) on a theta-phi plane.
For reference we show a 2D slice of the gas density for the s=2 (top) and s=0 (bottom) models.