Basic 1D problems and their solutions
Now comes the practical aspect of the tutorial: modifying VH-1 for different problems. This page describes 4 standard 1D test problems along with suggestions for extending those problems and taking it one step further with other suggested problems. The examples presented here were run on a grid of 100 zones (i.e. imax = 100), but you are free (encouraged) to run at lower and/or higher resolution. We will discuss geometry, boundary conditions, and initialization within each problem, give example results, and suggest ways to investigate each solution in more detail.
Sod Shock Tube
The Sod shock tube is a Riemann problem used as a standard test problem in computational hydrodynamics. The initial conditions are very simple: a contact discontinuity separating gasses with different pressure and density and zero velocity everywhere. In the standard case the density and pressure on the left are unity, and the density on the right side of the contact is 0.125 and the pressure is 0.1. The ratio of specific heats is 1.4. For a more complete description of the Sod problem, see the article in Wikipedia.

The problem requires two regions, and there are two ways to go about locating the midpoint to separate them. We could either look at the zone number (n = imax/2 + 6), or we could use the physical position (xa0 = 0.5). Either one would work, and we arbitrarily choose the latter option. The grid initialization takes place as a loop over all the zones in the grid; here it's a single one-dimensional loop, though more complex problems require nested loops for multiple dimensions. So within the loop over n, check to see if the zone in question is before xa0 = 0.5. If it is, set the pressure and density to pleft and dleft; otherwise use pright and dright. All three components of fluid velocities should be zero at the start.
If you've set up the grid correctly, you'll see three major things happen as you evolve the simulation. A shock will propagate to the right into the undisturbed gas, the initial contact discontinuity will drift to the right, and a rarefaction wave will travel to the left.
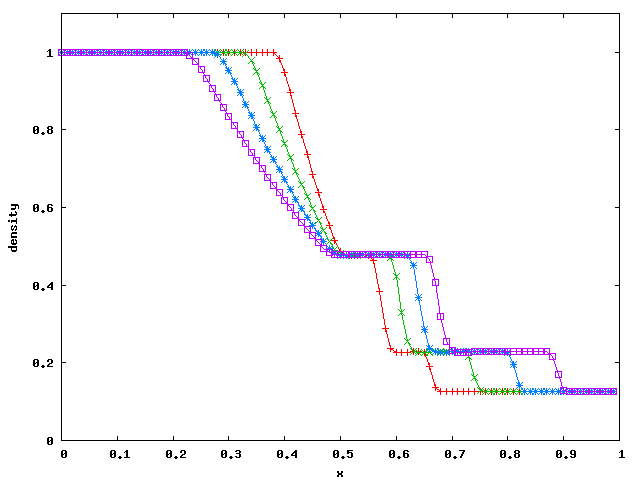
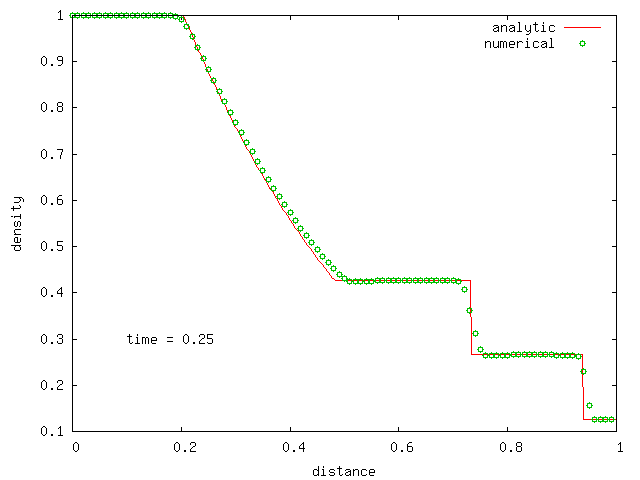
We can compare these results to the exact solution. A code to compute the semi-analytic solution to the Sod problem is available from Dr. Timmes' cococubed website. Here is a data file generated by his code: sedov.dat. The plot below shows this analytic solution (red line) and the VH-1 solution (green circles). In general, all of the sharp features of the exact solution are spread out by one or more zones in the numerical solution, but the values of the fluid variables in the intermediate states are quite close to the exact values. The shock is typically spread out over two zones. The contact discontinuity at x=0.73 is spread out over four zones. This can be improved by implementing the contact steepener described in CW, but this has not been done in VH-1.
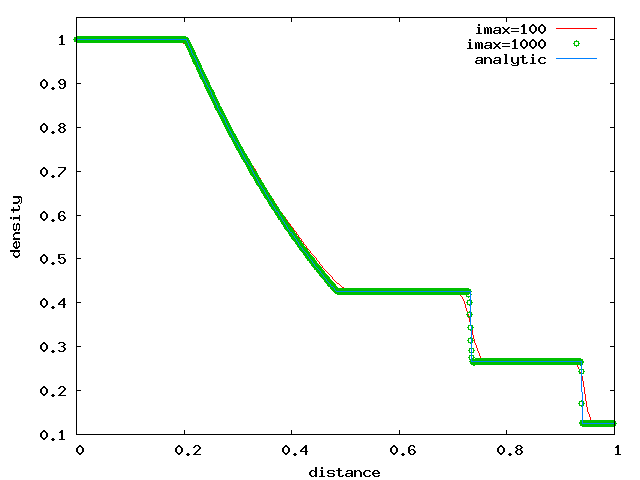
This solution can be made more accurate by running with higher spatial resolution. Try running the exact same problem, stopping at the same endtime, but with imax = 1000. Note that the solution takes longer for your computer to calculate. This is due to two effects. First, your computer has to update 1000 zones each time step instead of 100, so you expect a 10-fold increase in the computation time. Second, the code has to run through 10 times as many time steps (look in the *****hst file) because the Courant limit on the value of dt is proportional to the width of a grid zone, dx0(n). Since there are 10 times as many zones, each zone is 10 times smaller and hence the value of dt is ten times smaller. Put the two effects together and the run time has increased by a factor of 100 (test this with the unix 'time' command), but the results are very nice. Note that the rarefaction wave is now in much better agreement with the exact solution.
If you want to take this one step further, try the more challenging (for the code) initial conditions suggested by Dr. Timmes: an initial density and pressure of 1 on the right and a density of 10 and a pressure of 100 on the left, the initial discontinuity is at x=2 and the grid extends from 0 to 5, the solution is evolved to a time of 0.4. The correct solution is shown on cococubed, or you can use Dr. Timmes' code to generate the exact solution.
Sedov Blast
 The solution for a blast wave created by a "point explosion" in a uniform medium
was derived independently during World War II by American mathematician John von Neumann,
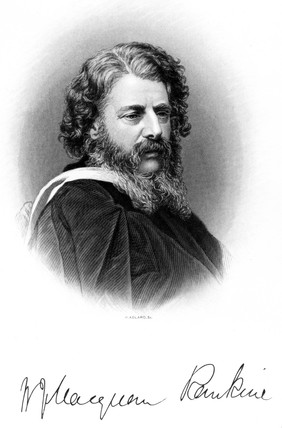
Soviet Physicist Leonid Sedov (pictured at right), and by Sir Geoffrey Taylor,
who joined the Manhattan Project as part of the British delegation in 1944-45. For
more information see the Wikipedia
blast wave article.
The Sedov-Taylor solution assumes a point source (negligible mass and volume) of total energy E is placed in a uniform medium with negligible pressure (meaning the expansion velocity of the blast wave is much higher than the sound speed in the ambient medium). Such a blast wave is characterised by two parameters, the ambient density (which we can set as unity), and the total energy of the blast, E.
If we assume the blast wave is spherically symmetric, we can set up our one-dimensional computational grid as a spherical radial coordinate (ngeom=2) with the left edge of the grid corresponding to the coordinate origin (xmin=0.0 and nleft=0). We will arbitrarily choose xmax=1.0, but one could choose physically meaningful radial dimensions if desired. The last grid parameter to set is nright. Since the solution is no longer valid once the blast wave reaches the right boundary of the grid, we will use the zero-gradient boundary condition in order to keep the ambient medium quiet at the outer boundary until the blast wave gets there.
The next step is to initialize the grid with appropriate values of density, pressure, and velocity. To begin, we want to set the entire grid to values corresponding to our uniform ambient medium. This should be zero velocity, a constant density (which we can choose to be unity or use physical units as desired), and a constant pressure that is small enough that the blast wave will expand supersonically. We could calculate an appropriate pressure given the Sedov-Taylor solution, but let's just choose a small value for now (p(n) = 1.0e-04) and check later that the expansion is supersonic: Calculate the speed of sound in this ambient medium and make sure the velocity of the blast wave is much higher than this value. You might want to calculate this value in the code and record it to the history file.
To create the blast wave we need to place a lot of energy at the origin. Let's take the
simplest approach (always a good place to start) and put all the energy in only one
zone (nmin) at the origin. If this energy is intended to be all
thermal energy, we do this by setting the pressure to some large value. Since this value
determines the scaling of our solution, lets be a little careful and start by defining a
parameter for the blast wave energy - say Eblast. You will need
to declare this as a real variable at the top of vhone.f90 and
then initialize this variable to some large value: Eblast = 10.0.
We can alwasy adjust the value later if this is too big or too small. To relate this
total energy to the pressure in the first zone we use the equation of state


The last step is to have the code write relevant parameters into the history file. For this problem that should include (at a minimum) the density of the ambient medium, the blast wave energy, and the adiabatic index.
Now comes the challenge of compiling the code. Make sure you have declared and initialized any new variables you have added to the code.
The last step before running is choosing control parameters for indat. The simplest, safest route is to start with a small value for the total number of cycles and set the time values to large numbers:
| Example indat for the Sedov blast wave problem |
|---|
&hinput
 rstrt   = 'no'
 prefix  = 'Sedov'
 ncycend = 10
 ndump   = 5000000
 nprin   = 10
 nmovie  = 1000000
 endtime = 9.9e+19
 tprin   = 9.9e+19
 tmovie  = 9.9e+19 /
|
Check the output at 10 cycles and if everything looks good rerun for 100 cycles. Check the output at 100 cycles and rerun for 1000 cycles. Ultimately you want the code to run long enough for the blast wave to get close to (but not touch) the right boundary.
Alternatively, we can use the known solution to calculate the time (in simulation units) for the blast wave to cross the grid.
Below is data plotted from a simulation time of 0.179 using gnuplot commands of the form:
| Example gnuplot commands for the Sedov blast wave problem |
|---|
gnuplot> set xlabel 'radius'
gnuplot> set key top left
gnuplot> plot 'Sedov1007.dat' u 1:4 t 'velocity' w lp, 'Sedov1007.dat' u 1:3...
|
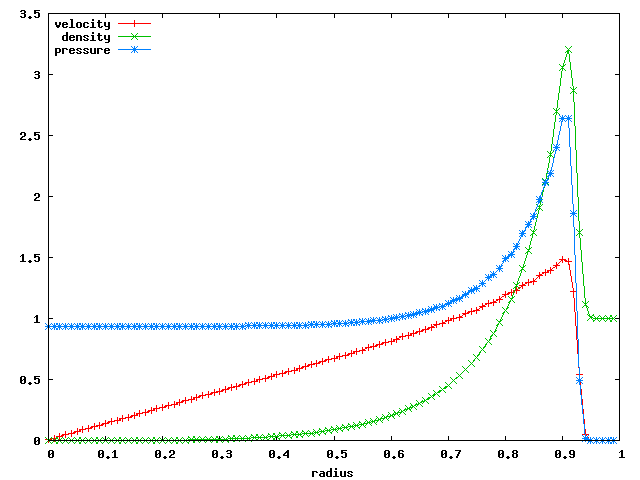
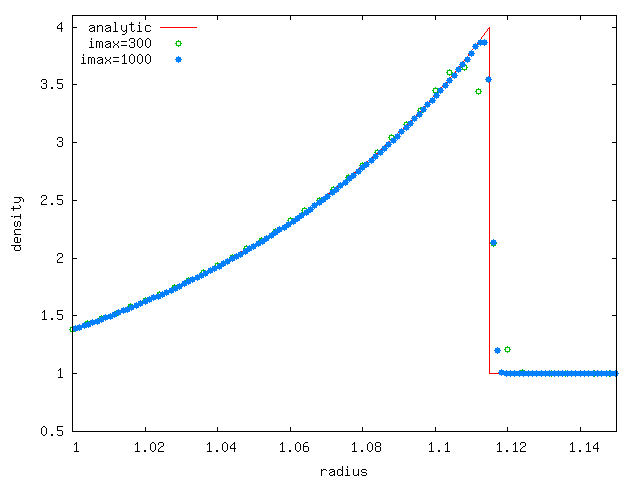
Finally, you can check your numerical results against the Sedov-Taylor solution. Again we can thank Dr. Timmes for providing a code to compute the exact solution, available on his cococubed website. The plot below shows output from VH-1 using imax = 300 and imax = 1000. This is one of those problems where you will never get the 'correct' solution and you have to decide how much rounding off of the peak you can get away with and still address the science you are investigating.
One Step Further: You can take advantage of the Lagrange-Remap algorithm to stretch the computational grid and follow the expanding blast wave. To keep things simple, we will use a constant grid speed, but you can do something more complicated like using the know velocity function of a Sedov Blast Wave or search for the location of the leading shock and stretch the grid to keep the shock at a fixed location on the grid.
Strong Standing Shock
 A nearly stationary, strong shock is the Achilles heel of the PPM method.
This problem sets up a strong, standing shock in 1D (2D and 3D can also be done),
allowing one to readily see the strong post shock oscillations and the effects on this
numerical noise of any dissipation scheme. The key to setting up this problem is the
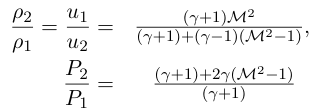
Rankine-Hugoniot shock jump conditions that relate the state of the gas on
the two sides of the shock. In particular, equations 17 and 18 in the
Wikipedia article give the post-shock values of density, pressure, and velocity
in terms of the pre-shock values. A more useful form of these equations, given in
terms of the Mach number of the preshock flow, is given by
For this problem you use a simple 1D cartesian grid as in the Sod problem. You can use the simple zero-gradient boundary conditions on both ends to start with, but be wary. The post-shock flow will be moving off the grid at subsonic velocities, and waves generated by post-shock noise may wreak havoc with the downstream boundary condition.

The only physical parameter in this problem is the Mach number of the shock, so create a variable mach and initialize it to 5 (you can change it later). You are free to pick values of the upstream (ahead of the shock) variables. To keep things simple, set the density and pressure upstream to unity. You want the shock to be stationary on the grid, so the upstream flow should be moving toward the shock at our chosen shock velocity given by the Mach number times the upstream sound speed.
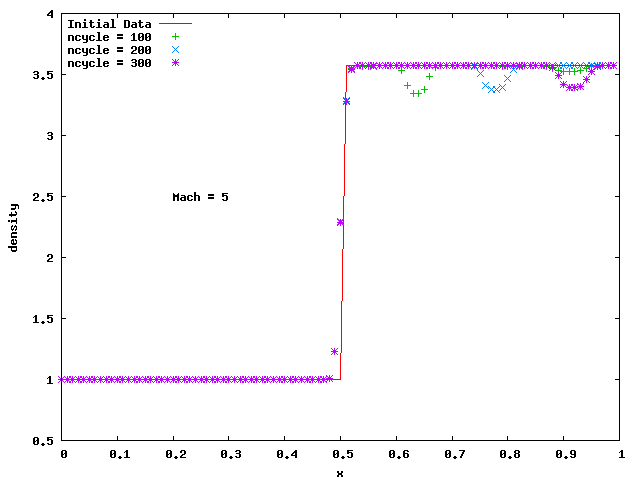
Now that you have the density, pressure, and velocity ahead of the shock, you should be able to use the Rankine-Hugoniot equations to find the density, pressure, and velocity downstream of the shock. The plot below shows the density at several points during the simulation. Note the large 'divot' in the postshock density. This is an artifact of our discontinuous initial conditions. Once this feature advects off the computational grid, we are left with a reasonably accurate model of a strong, standing shock.
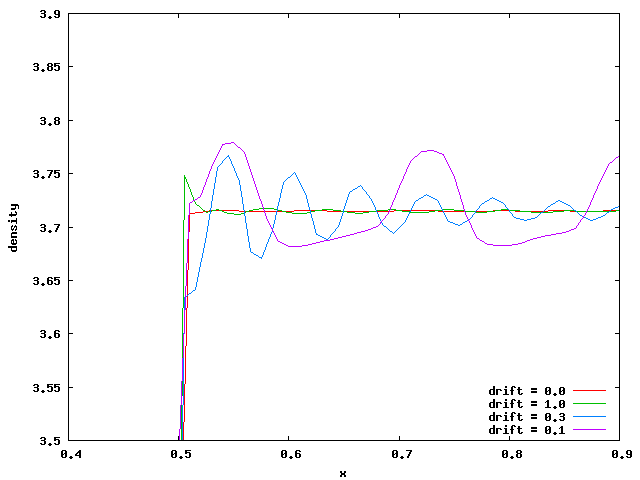
The results above look fine - no hint of a problem. However, if you add a small velocity to the initial conditions such that the shock is moving slowly with respect to the grid, the postshock solution exhibits strong oscillations. Here we show some examples, where the value of drift is the drift velocity that we have added to our initial conditions. We have shifted the results horizontally so the plotted solutions all have the shock at the same position. Note that as the drift speed increases, the wavelength of the oscillations decreases and the amplitude is damped as the waves move downstream. The damping is numerical - when the wavelength becomes too small compared to the grid (of order 10 zones per wavelength) the dissipation in the algorithm dampens the wave. By the time the shock is moving relatively fast (compare drift to the upstream sound speed) the oscillations are of sufficiently small wavelength that they cannot propogate across the grid.
Bondi Accretion
 The rate at which gas is accreted from a uniform interstellar medium onto a
star was first calculated by
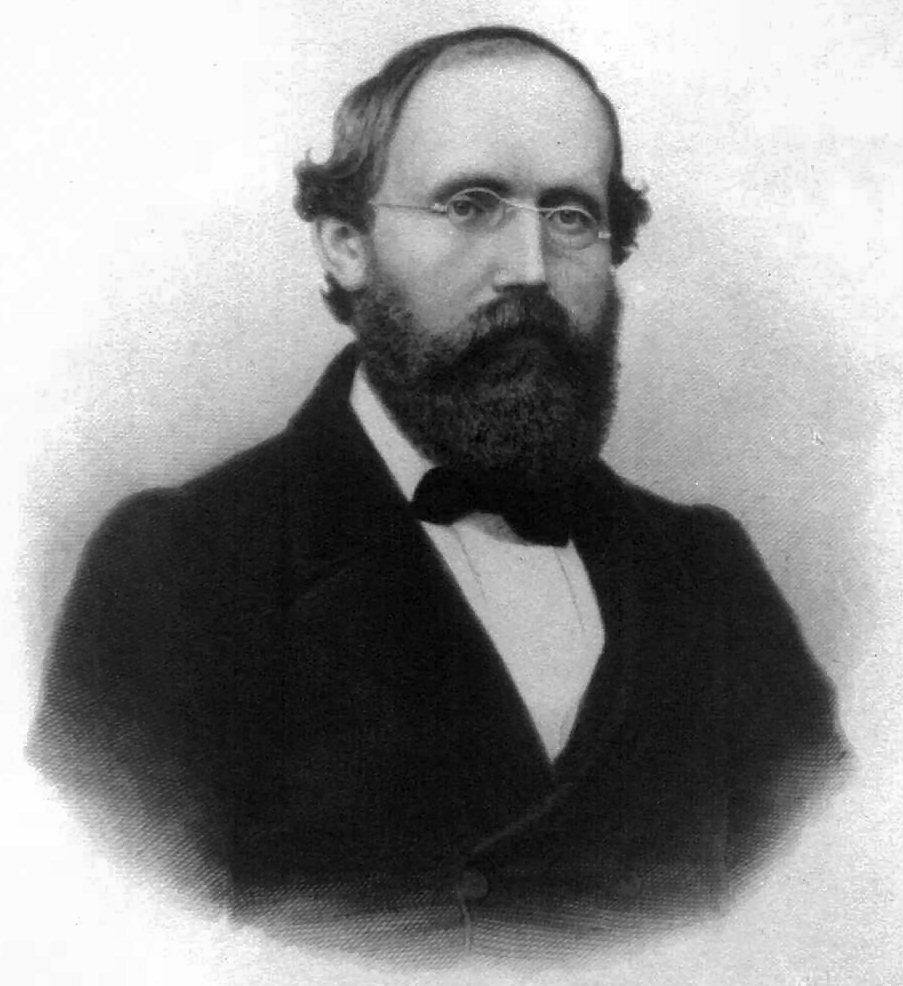
Hermann Bondi
(pictured at right) in 1952. We use this problem as an example
of modifying PPMLR/ to include an external force, in this
case a point source of gravity.
The Bondi problem assumes a uniform medium with essentially zero velocity at a large distance from a gravitational source. Gas gradually accelerates toward the source and eventually makes a transition to supersonic flow (for gamma < 5/3) at the sonic radius given by


As with many astrophysics problems, we begin with the assumption of spherical symmetry. To that end we define the computational grid with spherical radial. The outer boundary, which must be placed far outside the sonic radius, should hold the simulation variables at the fixed values of the ambient medium. To implement this, use the nright=2 option and set the variables dotflo, potflo to the values you chose for the ambient medium. uotflo, votflo, wotflo should all be set to zero. The inner boundary may be more challenging, but for now use the simple option of zero gradients. This should suffice if the flow at the inner boundary is moving inwards supersonically, which requires gamma < 5/3 and a radius much smaller than the sonic radius.
To add the gravitational acceleration of a point mass, -GM/r2,
the appropriate section in forces.f90 should be
modified to be
- grav(n) = -GM / xf(n)**2
The initial values for the fluid variables can be set to the values for the undisturbed medium. For simplicity we choose the density and sound speed to be unity. Using a value of gamma = 4/3, this puts the sonic radius at 0.25. We want the grid to span radii from smaller than this value to much larger than this value. Start with xmin = 0.1, which should be small enough that the flow off the inner edge is supersonic. The outer radius would ideally be orders of magnitude larger than the sonic radius, but this is not practical. Try xmax = 10.0 as a start, but keep in mind that this is not 'far' away. Since our grid is spanning a large dynamic range in radius, we will need to use a relatively large number of zones. The data shown below is from a simulation with imax = 500.
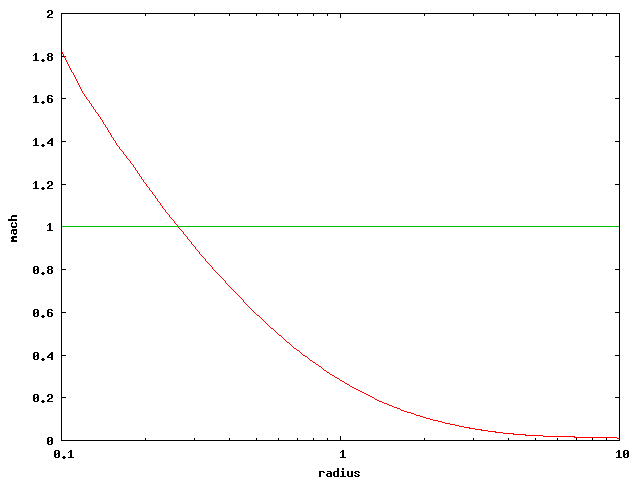
The Bondi problem is characterised by a sonic transition at a theoretical radius of 0.25. Rather than plot the density or velocity, here we plot the mach number of the flow using the gnuplot command
- gnuplot> plot 'bondi1009.dat' u 1:(-$4/sqrt(1.333*$3/$2)) w l, 1.0
Lets test one of these by pushing the outer boundary farther away. To do this without having to add a larger number of zones, we will create a logarithmic grid in which each zone is larger than the preceding one by some factor z that is slightly larger than 1. If we want the zone width to be proportional to radius this factor will be given by ln (z) = ln (xmax/xmin) / imax.
Using the same 500 zones and pushing xmax out to 100 gives z = 1.014. Note that the flow time at large radii will be very long (small infall velocity, large distances to cover), so it will take a long time for the flow to reach a steady state. The code to initialize grid coordinates should look more like the following...
| Creating a zoomed grid |
|---|
zoom = exp(log(xmax/xmin)/real(imax))
dx0(nmin) = (xmax - xmin) * (zoom - 1.0) / (zoom**imax - 1.0)  ! width of first zone
xa0(nmin) = xmin
do n = nmin+1, nmax
  dx0(n) = dx0(n-1) * zoom        ! each zone is a factor of 'zoom' larger than the previous
  xa0(n) = xa0(n-1) + dx0(n)
enddo
|
You can also check your results against the analytic value for the mass accretion rate referenced above.